Exercises
- Examine the three datasets shown in Table 3.3. Which of these are linear relationships?
- A new fast food chain has studied its success in its initial metropolitan market. They found that their net income from the opening and operation of each site could be represented by this linear equation:
I = b * 275000 – 100000
Where I represents the net revenue in dollars over one year , b represents the number of branches, and the constant represents the upfront costs of creating a new location. They have tested this relationship in their current market where they have 10 branches. If they are going to open a new market in a different metropolitan region, what would their net income be if they opened 4 branches, 8 branches, and 12 branches? Will this model work for all of those situations? What are the uncertainties to applying this model in this way?
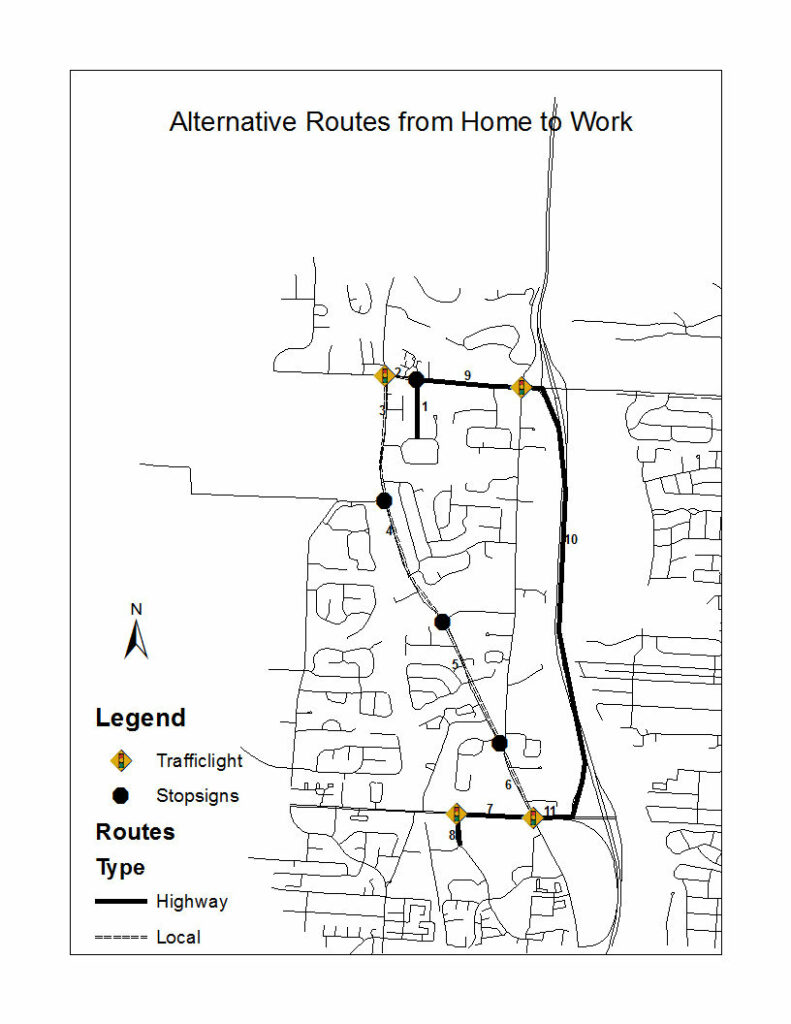
- We have implemented a model of the time it will take to get from our home to work comparing two major potential routes: one using local and major streets, and one that makes part of the trip on an Interstate highway. Use the materials below to download the instructions and the partially completed code in either MATLAB or Python. Complete the code and make the model runs required to answer the questions about this model.

- Water towers are used to store water and release the treated water under sufficient pressure to reach the buildings in its service area and maintain pressure to keep the water from becoming contaminated. Using the materials below download the instructions and the partially competed code that predicts how tall the water tower needs to be to achieve the minimum necessary pressure. Complete the code in either MATLAB or Python and make the runs necessary to answer the questions about this model.
